Analytics: Understanding Your Time and Work Patterns
Last updated: June 2, 2026
Billables AI’s Analytics feature gives you a clear, structured view of how your time is spent—across clients, matters, activities, and more. Whether you're an individual timekeeper or a firm administrator, Analytics helps you understand patterns, identify gaps, and make more informed decisions about your work.
What is Analytics?
Analytics is a centralized dashboard that visualizes your time data captured in Billables AI. It transforms your day-to-day activity into actionable insights, helping you answer questions like:
Where is my time going?
How much of my work is billable vs. non-billable?
Which clients or matters take up the most time?
How has my time allocation changed over time?
Key Metrics You Can Track
Within Analytics, users can break down their time across several dimensions:
By Client and Matter
See how much time is spent across different clients and matters
Identify high-effort matters or clients that may require attention
Better understand workload distribution
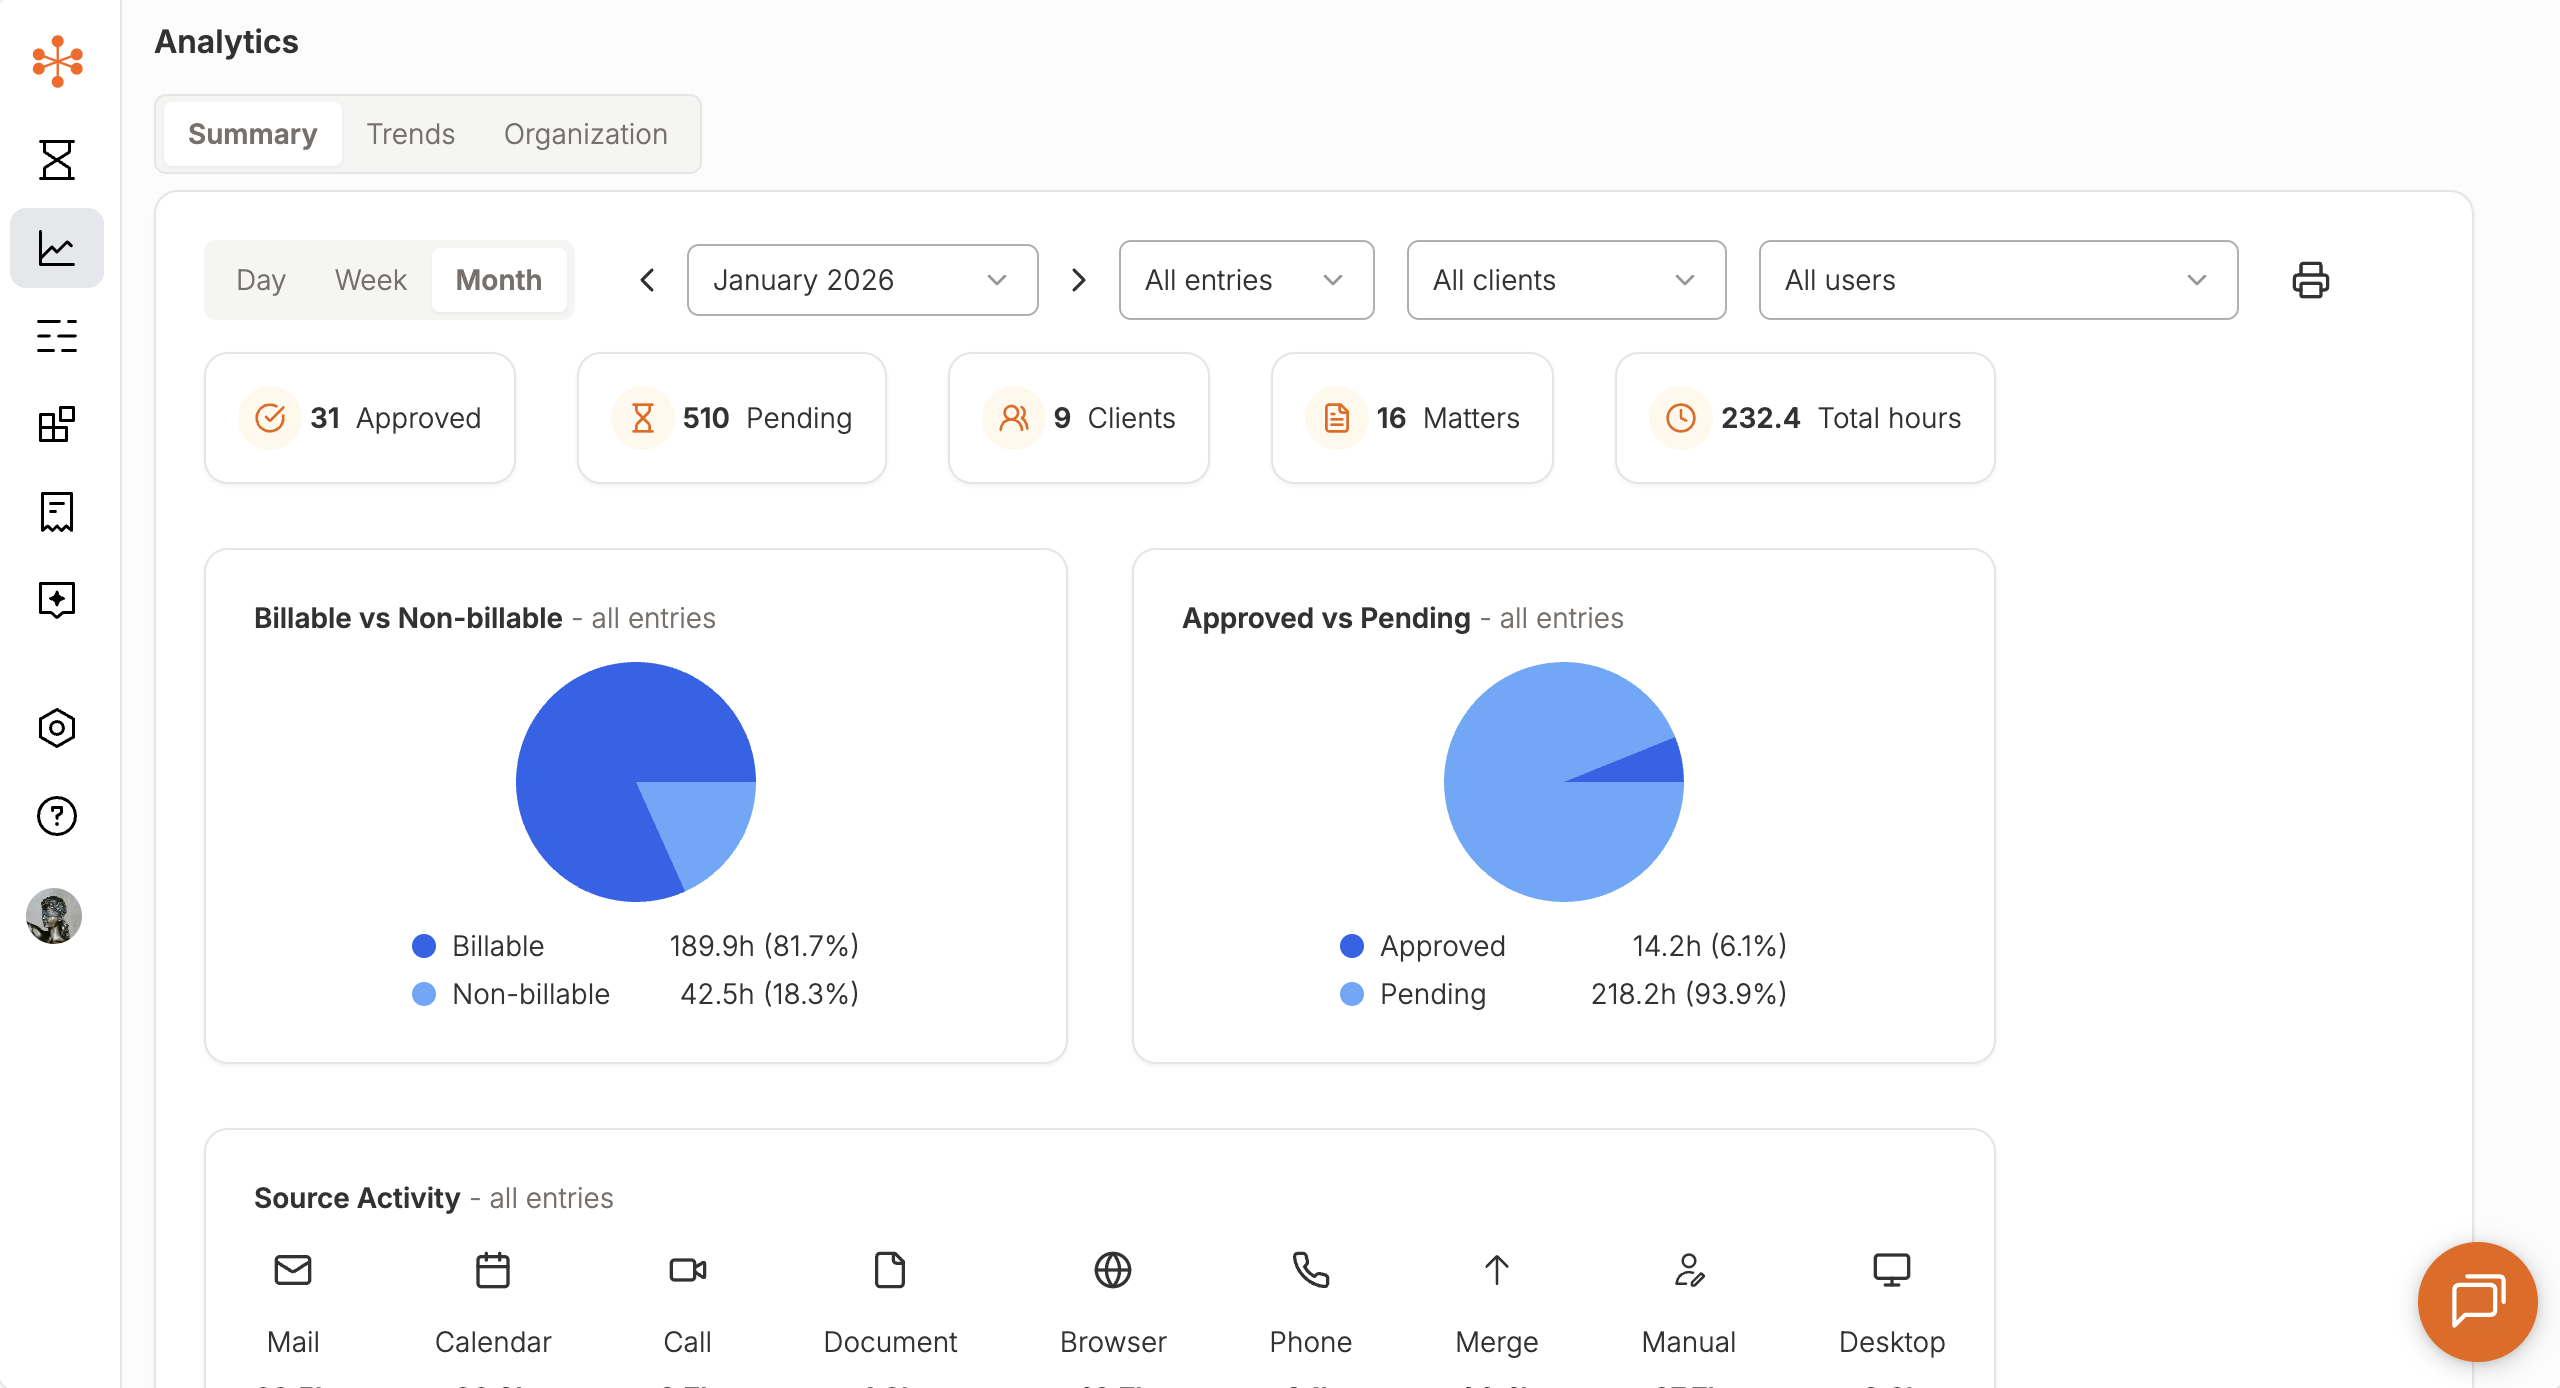
Billable vs. Non-Billable Time
Track how much of your work is billable
Identify opportunities to improve utilization and realization
Approved vs. Pending Time
Monitor the status of your time entries
Quickly identify entries that still need review or approval
Activity Type
Understand how your time is spent across different types of work, such as:
Email
Meetings
Document drafting
Calls and other activities
This helps you see not just how much you worked, but how you worked.
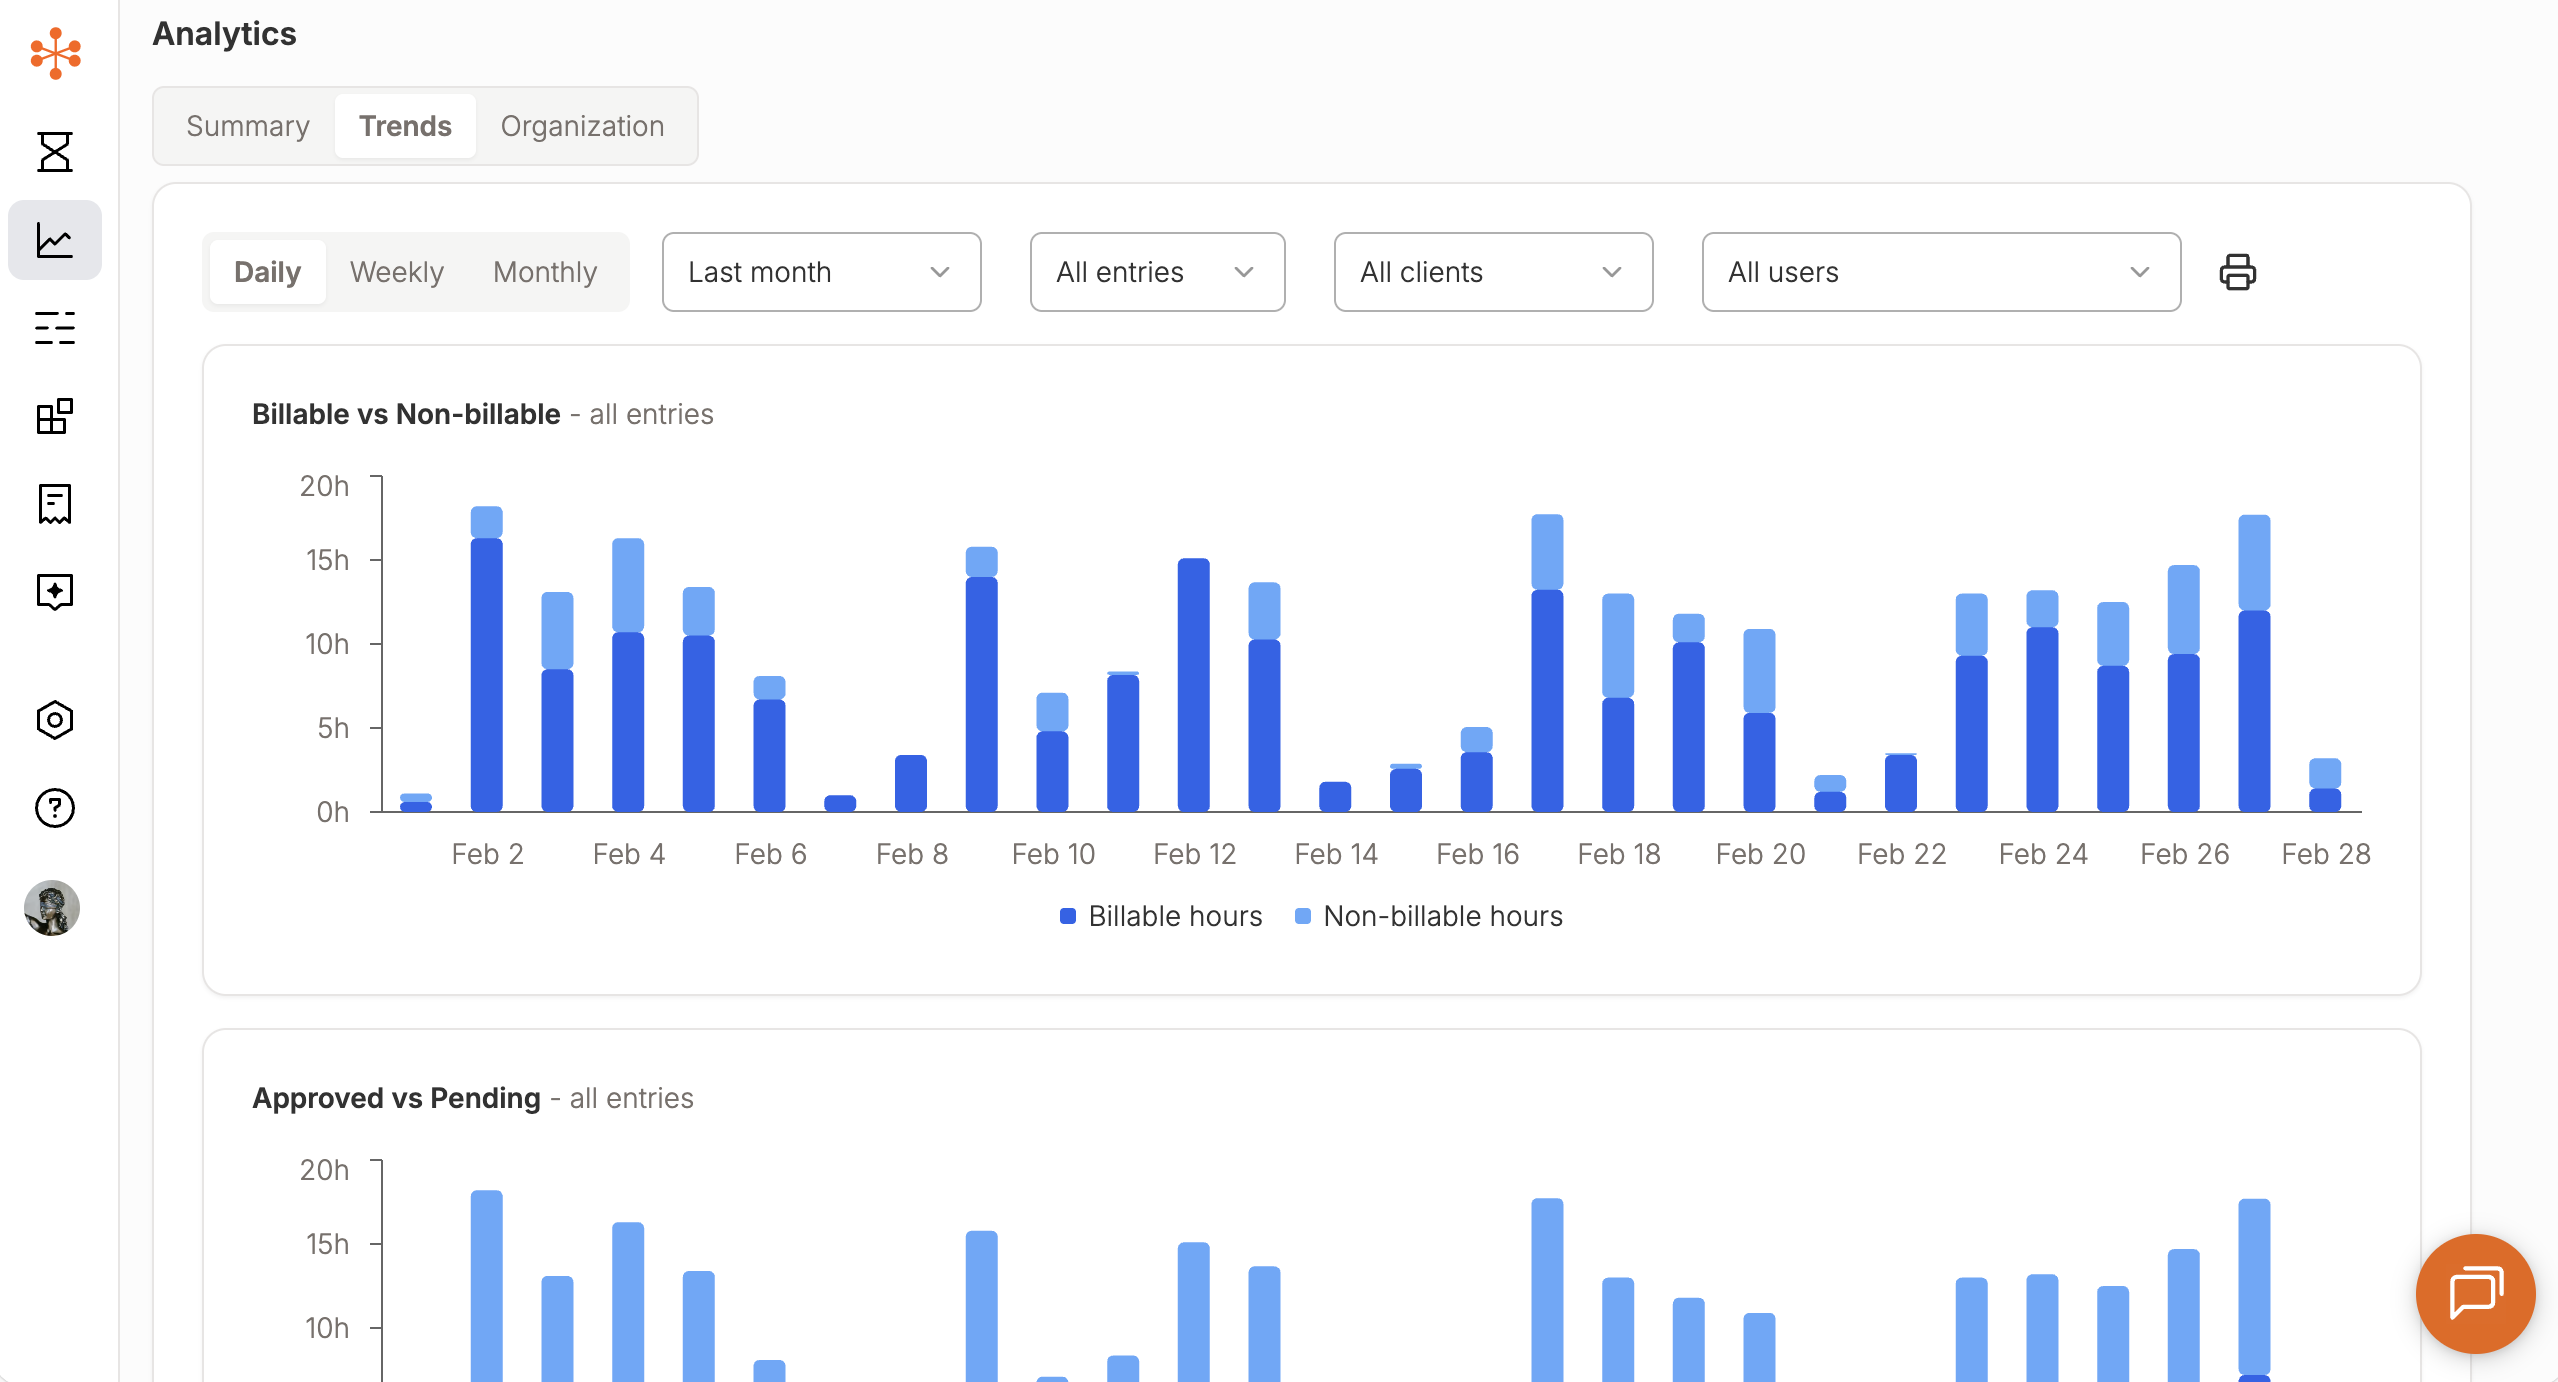
Trend Analysis Over Time
Analytics allows you to visualize your time trends across different timeframes:
Daily view – Understand your day-to-day activity
Weekly view – Spot patterns in your work habits
Monthly view – Track longer-term trends and performance
These views make it easier to:
Identify consistency (or gaps) in time capture
Understand workload fluctuations
Monitor progress toward billing or utilization goals
Admin View: Firm-Level Insights
For administrators, Analytics provides a broader view of firm activity while maintaining user-level privacy.
Aggregate Time Data
View total time across all users
Analyze firm-wide trends and productivity
Per-User Breakdown
View summarized data by individual users
Compare time allocation and activity patterns across the team
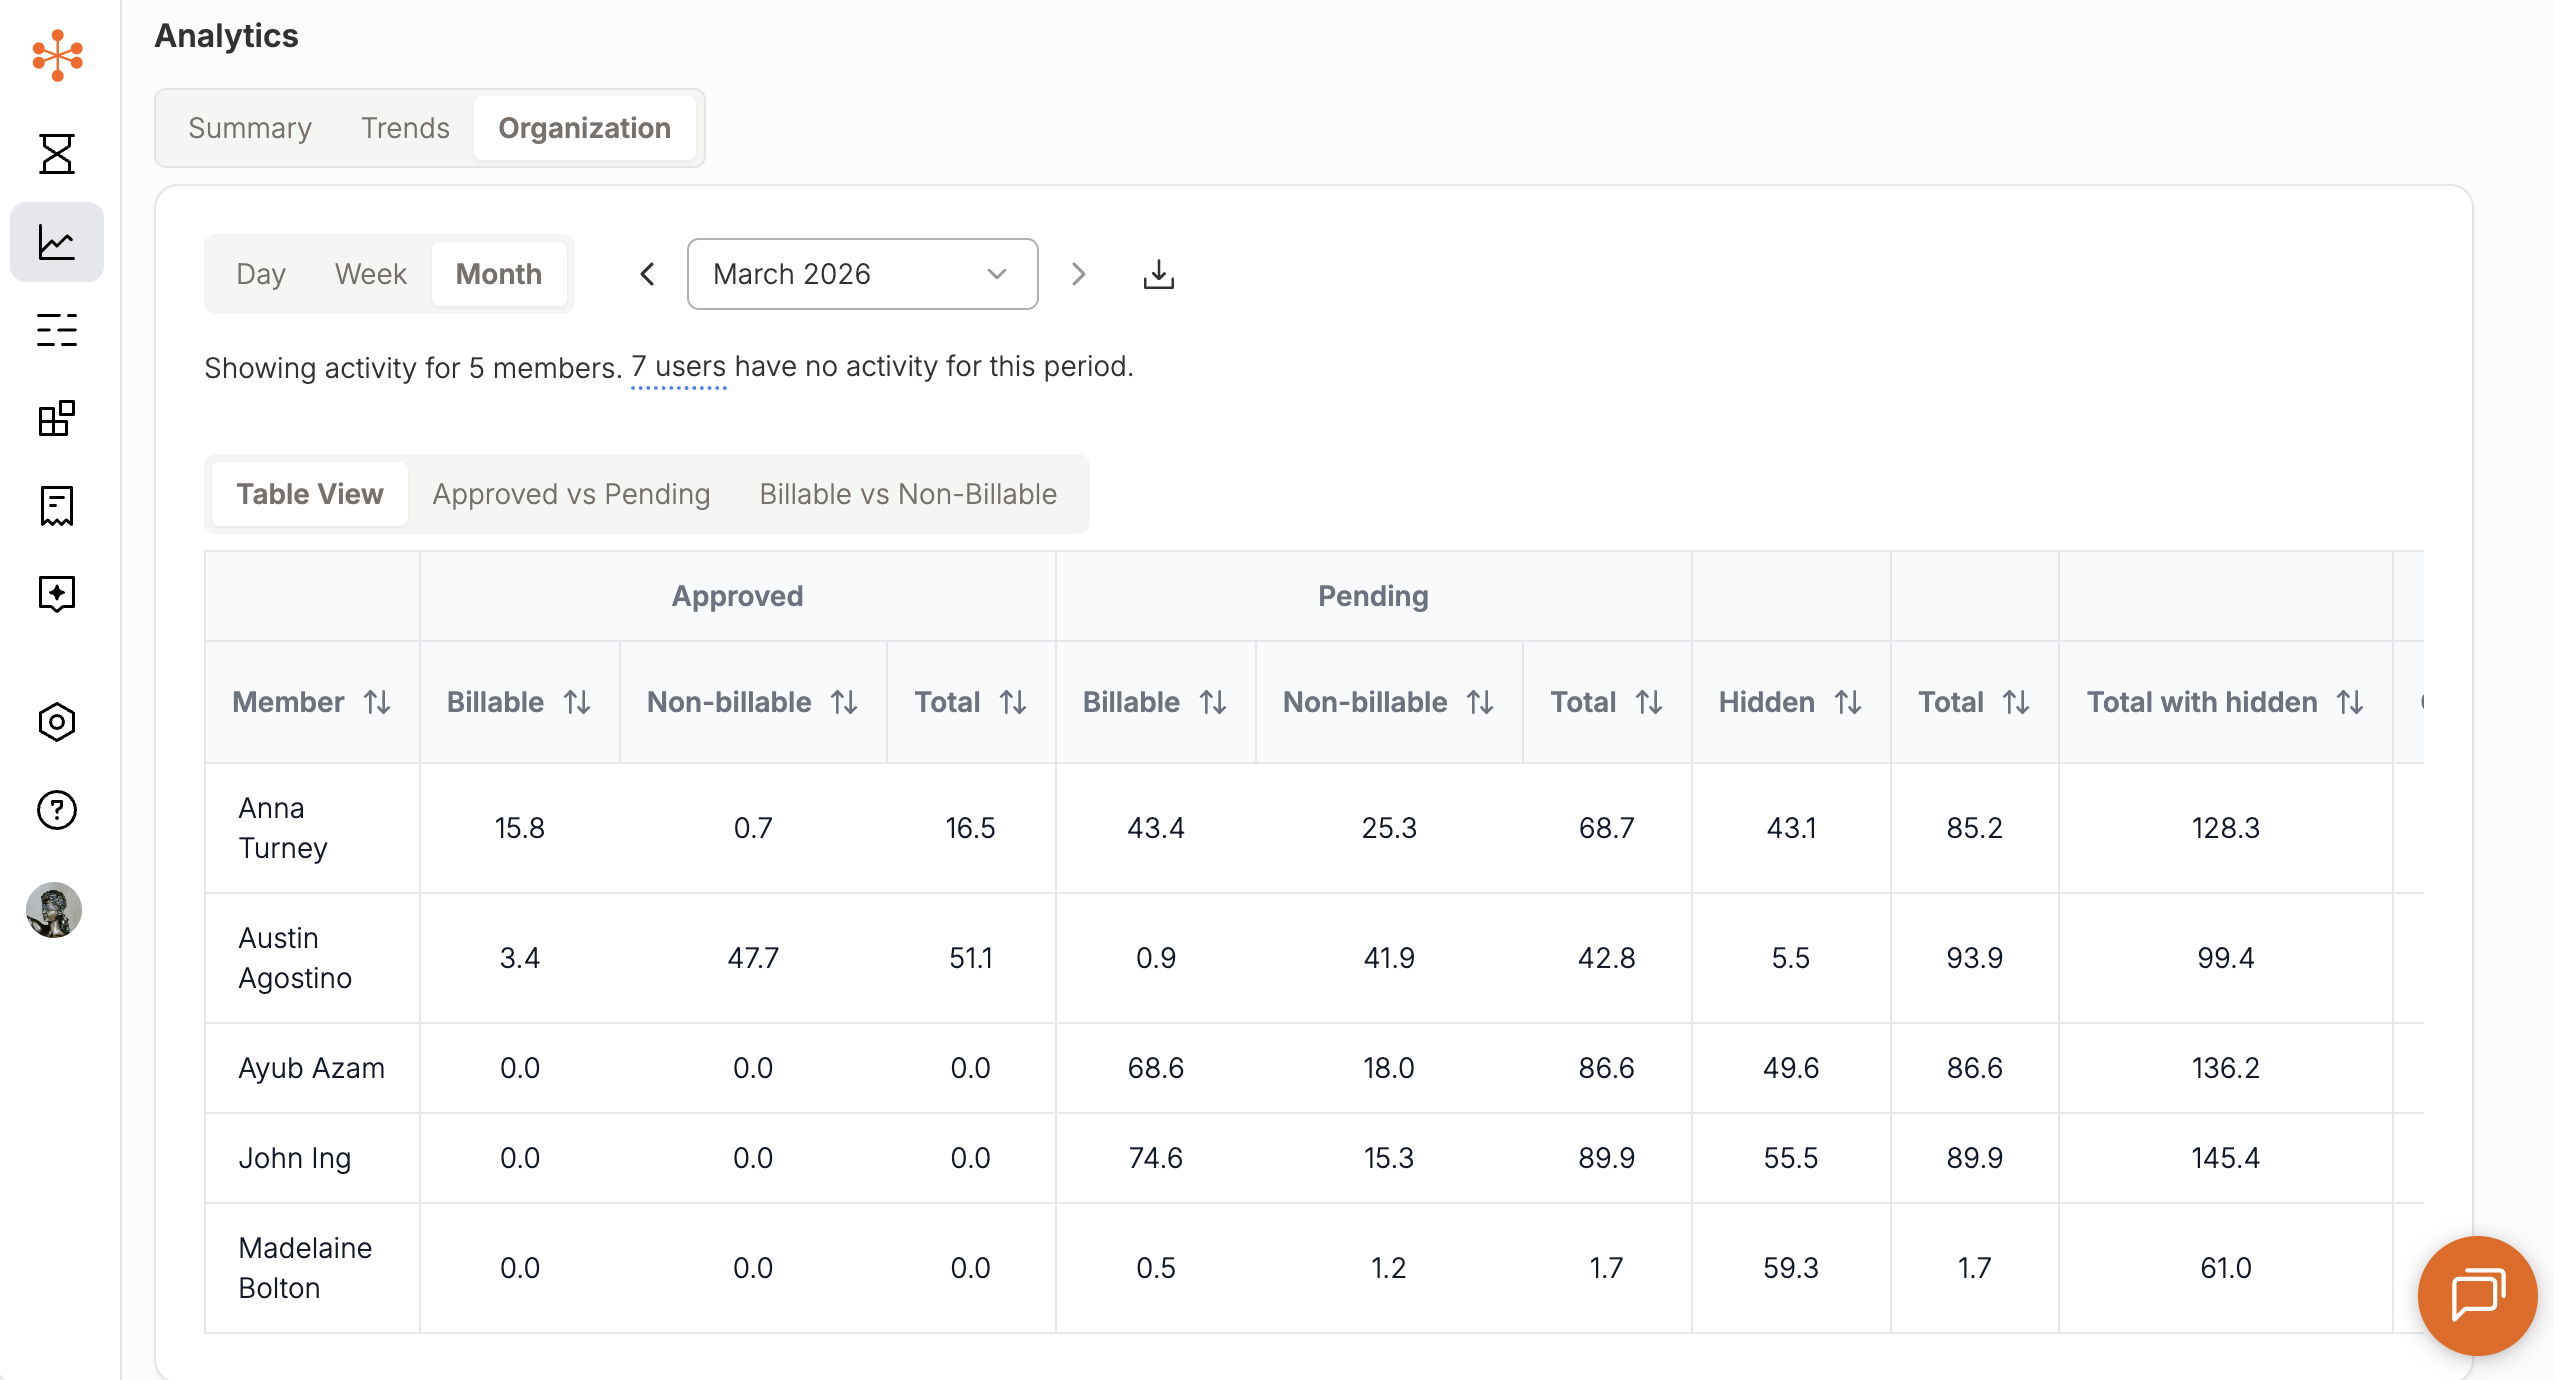
User Table View
Access a table listing all users with their key metrics
Quickly scan and compare performance across the firm
Note: Admins can view aggregated and summarized data, but do not have access to individual time entry details within Analytics.
Why It Matters
Analytics helps turn timekeeping into insight. By understanding how work happens across your firm, you can:
Capture more billable time
Improve timekeeping consistency
Identify inefficiencies in workflows
Make more informed operational decisions
Getting Started
To access Analytics:
Navigate to the Analytics tab in Billables AI
Use filters to customize your view (client, matter, date range, etc.)
Toggle between charts and tables to explore your data